
问题标题
在vchart图表库中如何让图表位于canvas的最左边?
问题描述
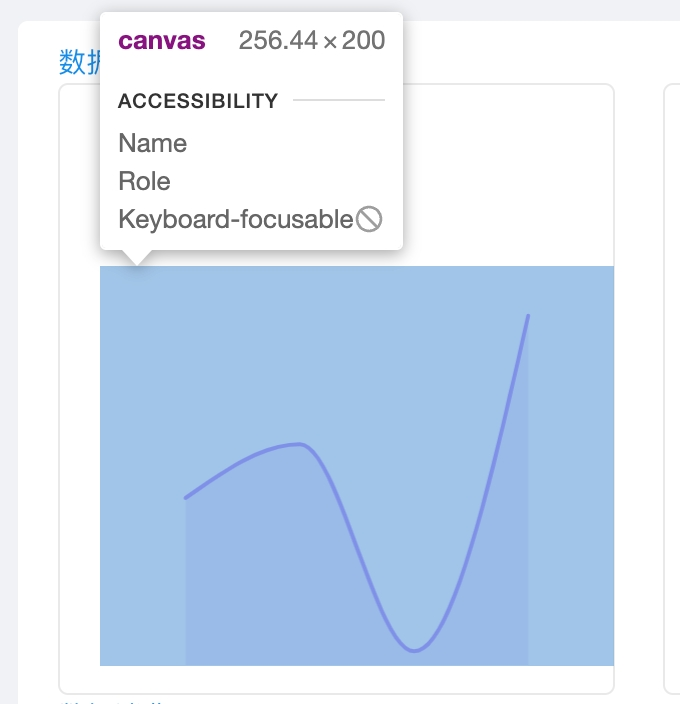
我正在使用vchart图表库进行可视化操作,我希望图表能位于canvas的最左边,然而我尝试调整配置的时候出了问题,不知道应该如何设置。
{
  type: 'line',
  data: {
    values: [
      {
        time: '2:00',
        value: 8
      },
      {
        time: '4:00',
        value: 9
      },
      {
        time: '6:00',
        value: 11
      },
      {
        time: '8:00',
        value: 14
      },
      {
        time: '10:00',
        value: 16
      },
      {
        time: '12:00',
        value: 17
      },
      {
        time: '14:00',
        value: 17
      },
      {
        time: '16:00',
        value: 16
      },
      {
        time: '18:00',
        value: 15
      }
    ]
  },
  xField: 'time',
  yField: 'value',
  axes:[
    {
      type:'band',
      orient:'bottom',
      visible:false,
    },
    {
      orient:'left',
      visible:false,
    }
  ]
};</br>
解决方案
在vchart的配置项中有一个trimPadding属性,该属性用于配置是否去除 band 轴两端的留白,如果为true,则两端不会有留白,并且bandPadding、paddingInner 和 paddingOuter 的设置将被忽略。
而在这里,我们需要的是将图表放置在canvas的最左边,即没有左边的留白,那么我们需要在'bottom'轴上加上trimPadding配置。
以下是配置的示例:
{
//...省略spec配置
  axes:[
    {
      type:'band',
      orient:'bottom',
      visible:false,
      trimPadding:true,
    },
    {
      orient:'left',
      visible:false,
    }
  ]
};</br>
结果展示
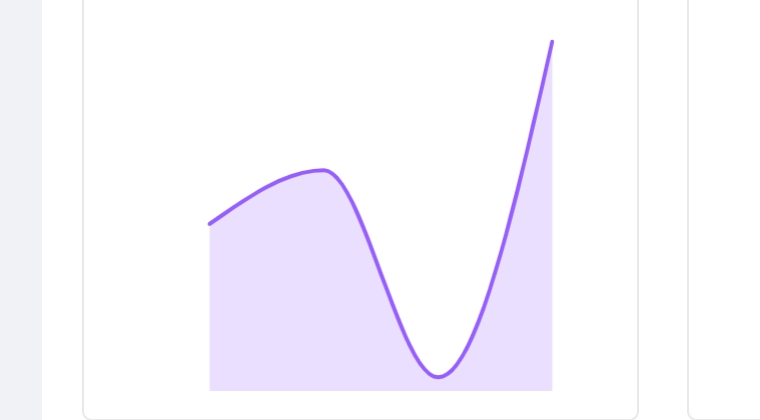
通过添加trimPadding配置后,图表现在已经可以正常显示在canvas的最左边了。
�在线效果参考:https://codesandbox.io/p/sandbox/common-chart-interactive-forked-cn95kp
相关文档
相关API:https://visactor.bytedance.net/vchart/option/barChart-axes-band#trimPadding
github:https://github.com/VisActor/VChart